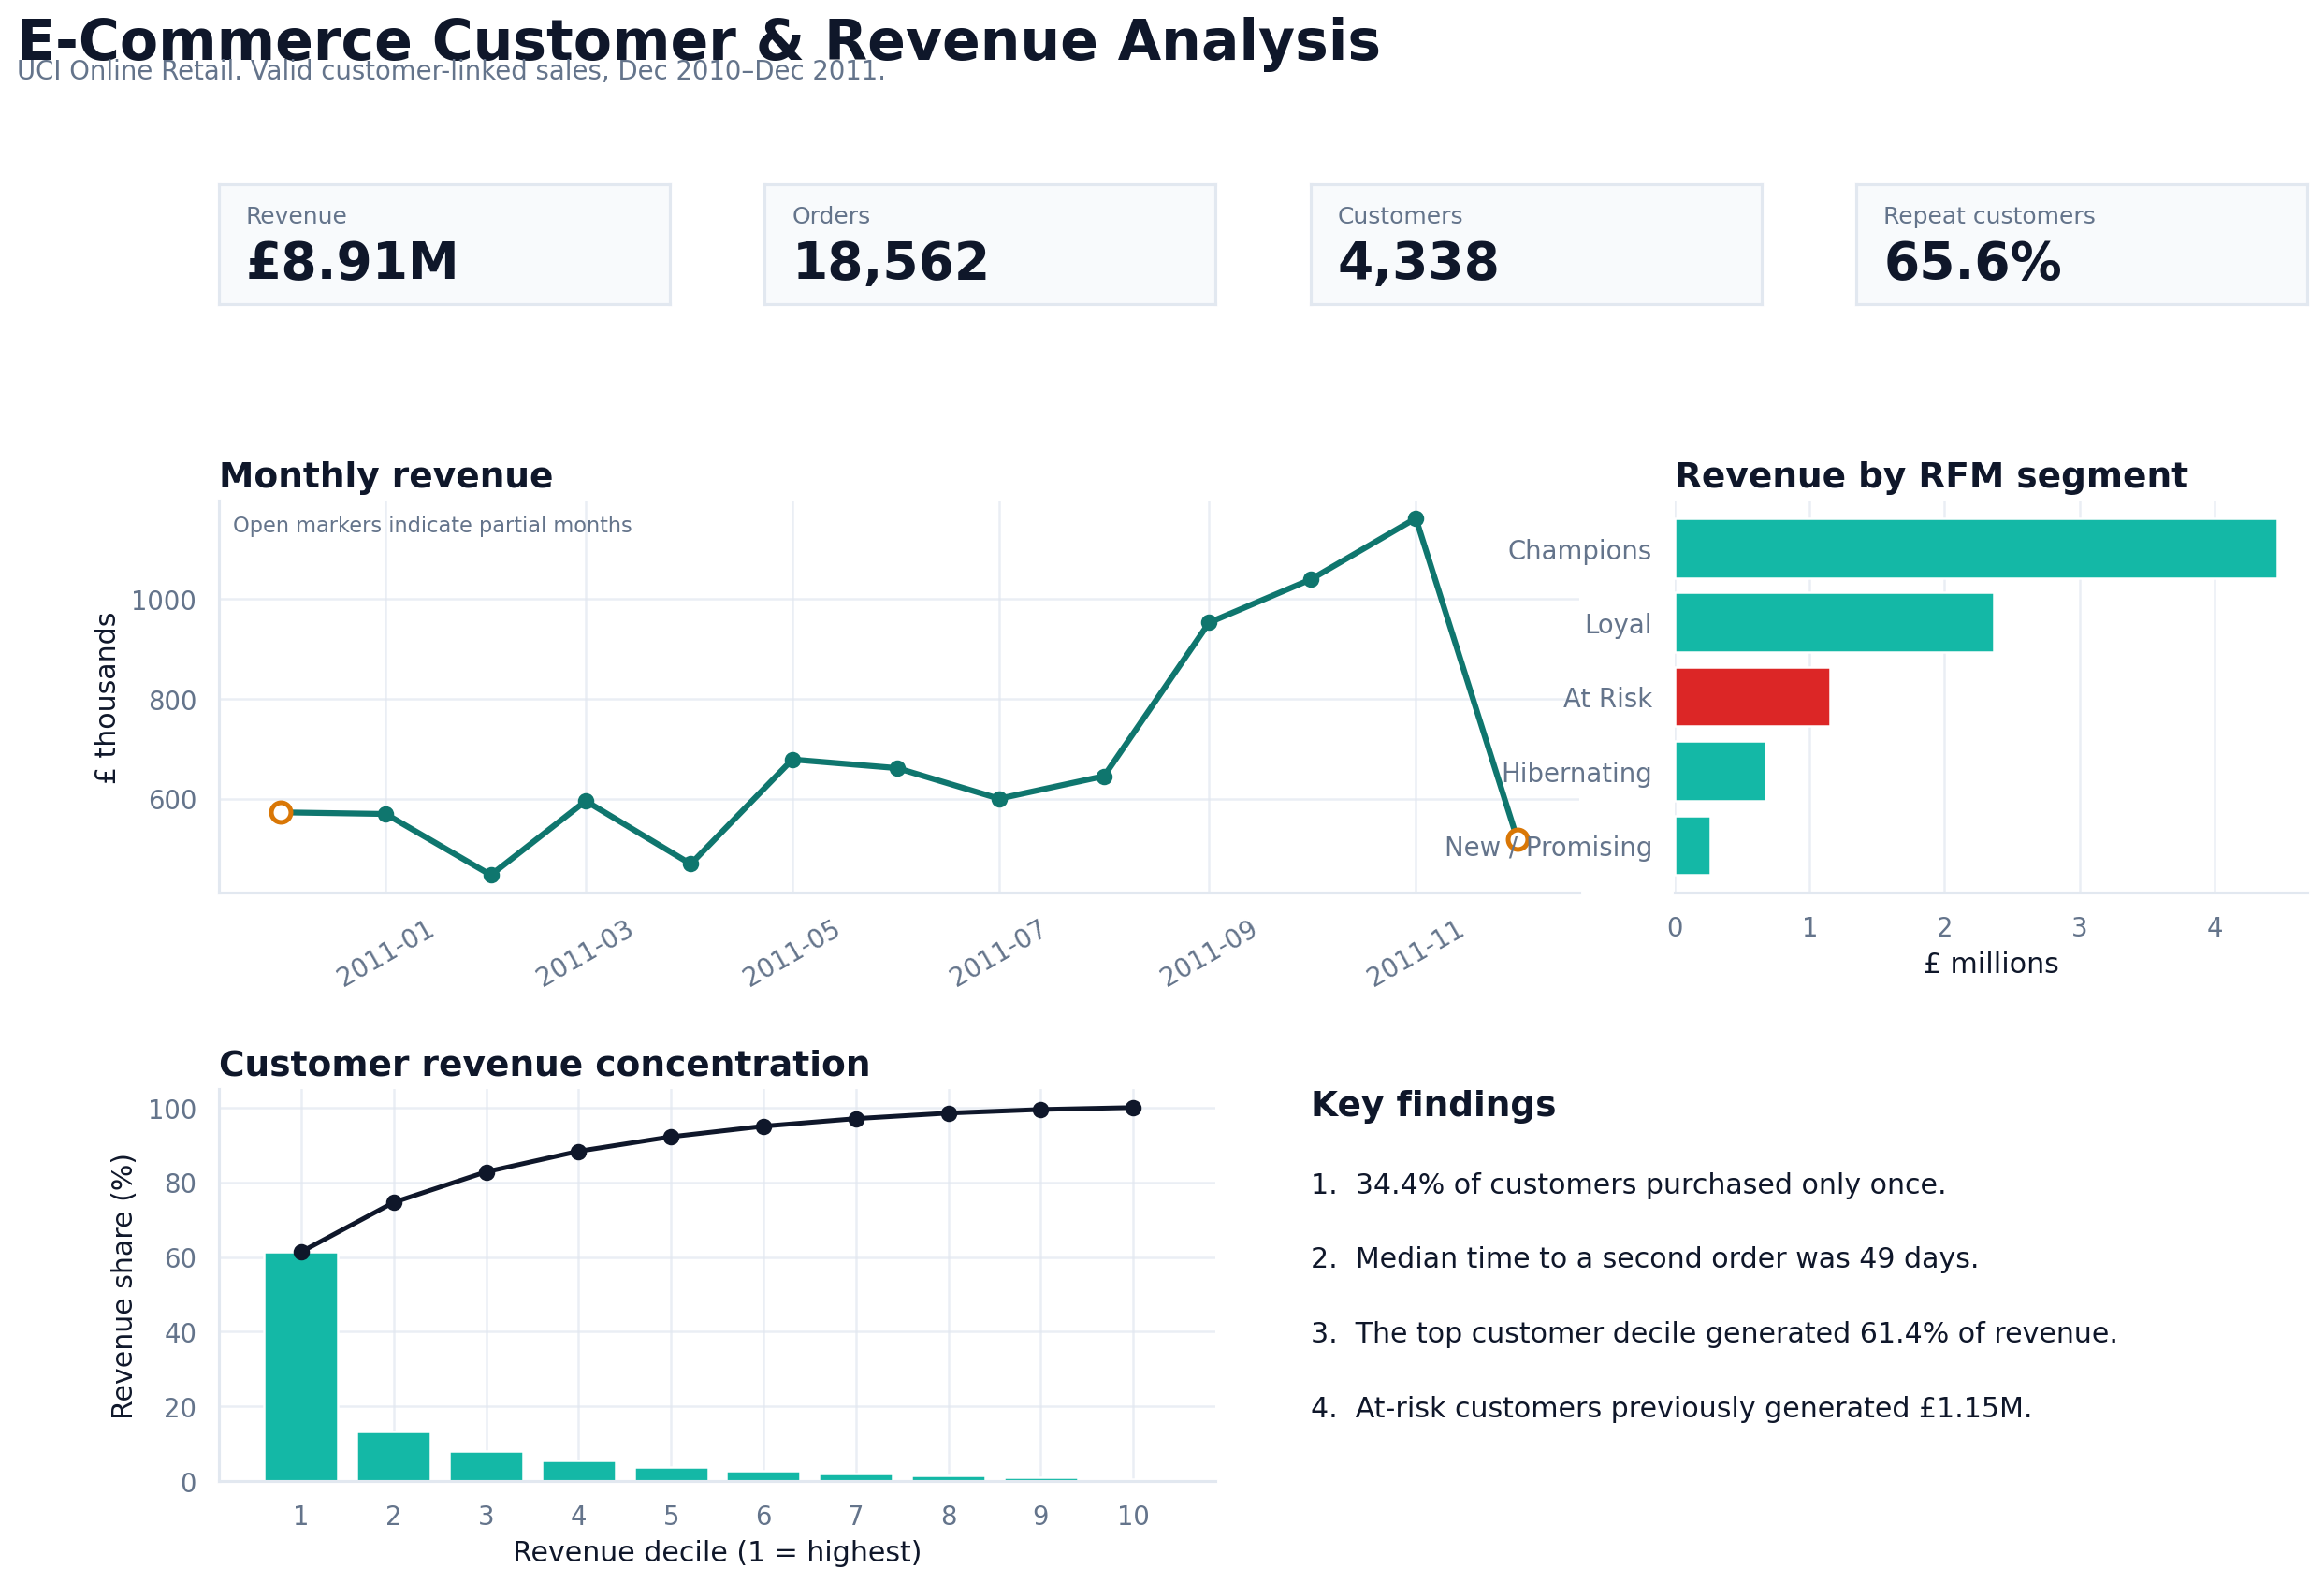
Data Analysis & Visualization
Cleaned, transformed, and analyzed structured datasets to check data quality, identify trends and relationships, and communicate findings through clear visualizations and dashboards.
- Python
- SQL
- Tableau
- Data Cleaning
I turn structured data into clear, actionable insights using Python, SQL, Tableau, and Excel, with a focus on data accuracy, visualization, reporting, and process improvement.
Cleaned, transformed, and analyzed structured datasets to check data quality, identify trends and relationships, and communicate findings through clear visualizations and dashboards.
Applied spreadsheet analysis and structured reporting to a $5,000 annual budget, tracking expenses, improving recordkeeping, and supporting more informed spending decisions and future allocations.
Built an interactive mapping application that lets users place and edit polygon points, calculate area and perimeter, save location records, and convert measurements across multiple units.
I’m a UC San Diego graduate with a B.S. in Cognitive Science: Design and Interaction and a growing focus on data analytics. My background combines technical problem-solving, data visualization, and an understanding of how people interpret and use information.
I use Python, SQL, Tableau, and Excel to analyze structured data, identify patterns, build visualizations, and improve reporting. My experience coordinating operations for 60+ employees and managing financial reporting for a $5,000 annual budget strengthened my skills in data accuracy, documentation, workflow tracking, and process improvement.
Use the form or email rguerre2004@gmail.com.